Article Content
What is CHIRPS ?
Climate Hazards Group Infrared Precipitation with Station data (CHIRPS) data is a 40 years quasi-global rainfall dataset where 0.050 resolution satellite imagery with in situ rainfall stations data are incorporated to generate gridded daily rainfall. The dataset is thus used for trend analysis, storm water analysis, seasonal drought monitoring and determining catchment properties.
Google Earth Engine on the other hand is a planetary-scale platform for spatial data storage and analysis. It contains multi-petabyte catalog of global datasets with analysis capability exposed to the users via JavaScript API, REST API or Python API. The tool is currently available for free for scientists, researchers, and developers to analyze the earths surface.
Steps for Using Google Earth Engine
If you do not have a Google Earth Engine account, Sign Up for one at Google Earth Engine signup page.
The following are the steps for generating rainfall data for an area of interest:
- Login to Google Earth Engine Code Editor which is exposed JavaScript API on your browser.
- Define the area of interest where you want to get rainfall for.
- Write your JavaScript code to generate rainfall.
- Export the rainfall as csv for further analysis.
Login to Google Earth Engine Code Editor
The Google Earth Engine Code Editor is Google Earth Engine JavaScript API exposed on your browser to access the analysis capability of GEE.
Once you login you get to the Google Earth Engine User Interface with various tools as shown below.

Define the Area of Interest
The area of interest can be defined in two ways:
- Create a geometry within the GEE User Interface
- Import a geometry and store it as an asset.
CREATE GEOMETRY
- Zoom in to an area of interest. In this case I have zoomed to Githunguri in Kiambu County, Kenya.
- use the Draw a Rectangle Tool on the geometry tools and draw a rectangle around your area of study.
- The drawn geometry is added to the Code Editor as a geometry input.
- Click on the geometry name in the code editor and change the name to AOI.
- Change the AOI from a polygon to a Feature Collection.
- You can also create the rectangle as a ee.Geometry.Polygon, define the coordinate corners manually and convert it to a Feature Collection.
var AOI = /* color: #ffc82d */ee.FeatureCollection(
        [ee.Feature(
            ee.Geometry.Polygon(
                [[[36.73002561679046, -1.0239043411067337],
                  [36.73002561679046, -1.119331362465192],
                  [36.85671171298187, -1.119331362465192],
                  [36.85671171298187, -1.0239043411067337]]], null, false),
            {
              "system:index": "0"
            })]);
JavaScript Code to Generate Rainfall
- Create a variable to access CHIRPS data.
- Write a code to filter chirps data by date.
- Get the mean rainfall per day based on the AOI.
- Generate a time series graph with a title with the Feature Coordinates, Y axis as the rainfall in millimeters and x axis as the day.
- Print the generated graph
The code has been provided below to execute the steps above.
var chirps = ee.ImageCollection("UCSB-CHG/CHIRPS/DAILY");

var precip = chirps.filterDate('2010-01-01','2021-02-28');
var AOI_Rainfall = AOI.select([]);
print(AOI_Rainfall);
AOI_Rainfall.evaluate(function (featureCollection) {
  featureCollection.features.forEach(function (feature) {
    var grahic = ui.Chart.image.series(
        precip.limit(5000),ee.Geometry(feature.geometry),ee.Reducer.mean(),1000).setOptions({
      title: 'Chirps Precipitation ' + feature.geometry.coordinates,
      hAxis: {title: 'Day'},
      vAxis:{title:'rainfall (mm/day)'}
    });
    print(grahic);
  });
});

Map.addLayer(AOI);
Map.centerObject(AOI);
Export the rainfall as csv
- Click Run the Script button to execute your code.
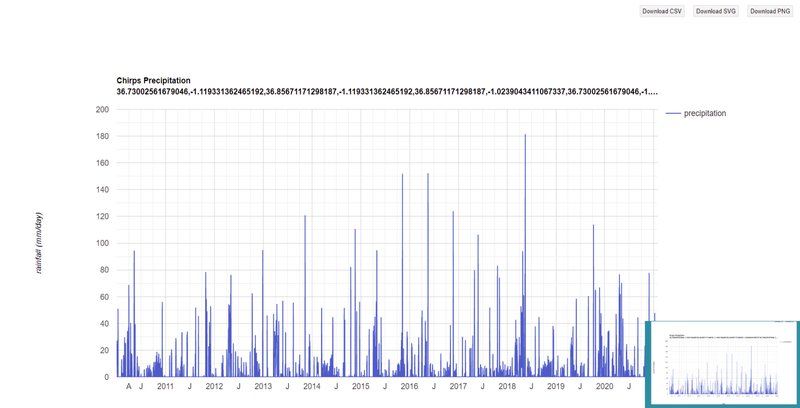
- After a while, the chart is generated for the time period specified and displayed on the Console.

EXPORT DATA to CSV and GRAPH as PNG
- On the chart click on the button to expand the chart. This opens a new tab with the graph.
- From the expanded graph three buttons exist from where you can export the data to csv or download the graph as SVG or PNG.